
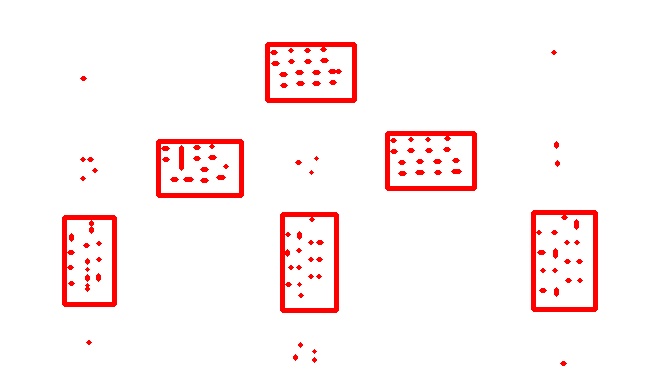
DBSCAN is a density based clustering algorithm, where the number of clusters are decided depending on the data provided. This is unlike K – Means Clustering, a method for clustering with predefined ‘K’, the number of clusters. Since it is a density based clustering algorithm, some points in the data may not belong to any cluster. Again, this is unlike K – Means Clustering where all the points are assumed to be belonging to some cluster. The result of DBSCAN clustering for a particular choice of parameters is shown in the image below. The red dots are the data points, and the rectangles are the clusters formed.
The Idea Behind DBSCAN
The idea behind DBSCAN can be explained with the help of it’s two parameters epsilon and min_points being used in the algorithm.
-> Suppose we have a dataset of n-dimensinal data points.
-> For each point in the dataset we make an n-dimensional sphere of radius epsilon around the point and count the number of data points within the sphere.
-> If the number of points within the sphere are more than min_points then we mark the center of the sphere to be belonging to a cluster. We also mark the points inside the sphere to be belonging to the same cluster. We then recursively expand the cluster by applying the same criteria to the points inside the sphere, except the center.
-> Incase the number of points inside the sphere are less than min_points, we ignore it and proceed to the next point in the dataset.
The parameters epsilon and min_points can be determined for the best possible clustering using the dataset itself. This method is called adaptive DBSCAN, which I’m not going to deal with over here. However, for practical purposes we may initialize the values manually if we know the kind of data we will run it on.
The Algorithm
Below is the pseudocode, organized as functions for our purpose. I have picked it up from Wikipedia since it is in sync with what I have explained. The function regionQuery() returns the points within the n-dimensional sphere. The function expandCluster() expands the cluster for each of the points in the sphere.
DBSCAN(D, epsilon, min_points):
C = 0
for each unvisited point P in dataset
mark P as visited
sphere_points = regionQuery(P, epsilon)
if sizeof(sphere_points) < min_points
ignore P
else
C = next cluster
expandCluster(P, sphere_points, C, epsilon, min_points)
expandCluster(P, sphere_points, C, epsilon, min_points):
add P to cluster C
for each point P’ in sphere_points
if P’ is not visited
mark P’ as visited
sphere_points’ = regionQuery(P’, epsilon)
if sizeof(sphere_points’) >= min_points
sphere_points = sphere_points joined with sphere_points’
if P’ is not yet member of any cluster
add P’ to cluster C
regionQuery(P, epsilon):
return all points within the n-dimensional sphere centered at P with radius epsilon (including P)
Things worth mentioning:
-> DBSCAN is a flexible algorithm, in the sense that it is dynamic with respect to the data.
-> The parameters needed to run the algorithm can be obtained from the data itself, using adaptive DBSCAN.
-> It gives a more intuitive clustering, since it is density based and leaves out points that belong nowhere.
-> It is very fast compared to traditional clustering techniques like K – Means Clustering since it has complexity O(n^2), n being the number of data points.
I have implemented the algorithm in C, and thus is quite fast. You can have a look at the code over here.

Nice explanation, I’m trying out DBSCAN too. Just wrote an implementation using Golang, needs some refactoring.
Greetings from Paraguay!
Thanks 😀
Greetings from India!
A compelling blog. Well done. Just FYI, the Jeffrey Epstein VI Foundation just launched its new website on artificial intelligence covering robotics to virtual software platforms to explore cognition: http://www.jeffreyepstein.net